Flipped students

I have mandatory work as a part of my position as a PhD-student here at UiT. Instead of doing a full-time PhD in three years (the norm in Norway), my PhD-stipend is for four years. This is because 25% of my time goes to duty work. So today I had my first students in the classroom! It felt great to be with students again – I’ve missed teaching!

They were first-year psychology students, with a “flipped classroom” course on academic skills (learning, thinking and writing). Instead of having a lecture with a teacher in the classroom, they watch pre-recorded lectures, take a quiz, and do some exercises in order to prepare for a seminar in the classroom.

The 220 students are divided into 8 groups, and I guide one the groups through some exercises/groupwork based on the material they’ve learned. It went well, and the students participated eagerly in the active learning process.

So after 10 months doing research in my office, wondering why I’m getting paid, I finally feel like I’m doing something that’s useful to others!

The survey is out!

I’m now collecting data with a pretest which measures students’ levels of IL and their interest in becoming information literate people, before IL-instruction from the library. Yesterday I introduced this survey to a class with 220 new psychology students, explaining what it measures, why it’s important that they contribute, and telling about the prize that they can win if they participate!

I’ve also sent info and a link to the survey to all teaching librarians here at UiT, and to library directors and/or librarians at all other Norwegian colleges and universities! I’ve made some contacts here and there over the years, so I hope that helps.  And most of all, I hope that students answer the survey, so I have some data to work with. No data, no PhD…

It takes a lot of work and logistics to carry out a survey like this. I must admit, I’m somewhat envious of PhD-students who don’t have to collect their own data! Many just receive a data-set from a researcher who hasn’t had time to analyze some aspect of it. They save potentially a year or more of their research time! Nearly half of the PhD-students in my statistics class had their data served to them in this manner. I think that this is quite common in medicine and psychology.

It’s not just collecting the data that takes time in the beginning stages, it’s also the development of the measuring tools, of course. I started developing the survey in February, and finished now in August. Survey items must be developed based on theory, all items must be piloted, and those results must be analyzed using several statistical analyses, before the final selection of survey items can be made (and later defended).

Besides the survey, I’ll also be using 2 other measurement tools, but these measures have been developed by others, and I’ll only make slight changes before I use them. I’ll write more about these in another blog-post.

On another note – one of my supervisors, Torstein Låg, together with colleague Rannveig Grøm Sæle, has just published a research article called: “Does the Flipped Classroom Improve Student Learning and Satisfaction? A Systematic Review and Meta-Analysis”. https://doi.org/10.1177/2332858419870489   Congratulations Torstein and Rannveig! Good work! 🙂

Decision made

After a productive meeting with my supervisors today, I’ve decided to use my own survey items instead of those in a similar survey. I have, after all, come farther in testing the validity of my items, so I know that they’ll be useful in measuring students’ levels of information literacy.

And as of 5 PM, the first survey is out! Phew… What a day!


Frustration

It’s over 2 months since my last post. I’ve been working on my research, but I’ve also taken some vacation. Even PhD-students need a little time off!

After lots of hard work formulating survey questions, getting expert opinions and think-aloud responses from students about the questions, doing a pilot survey and analyzing the results with several statistical tests to decide which questions to keep, working out the logistics of survey distribution this fall (the plan was to start collecting data tomorrow!) – I just got a major blow. After all that work, I just found an article by a PhD-student in England who did the exact same thing that I’ve been trying to do! She beat me to it!

I’ve been attempting to make a relatively short, openly available test of information literacy that could assess students’ knowledge and abilities, independent of their study or location. (Other IL-tests out there are mostly either discipline-or geographically-specific, or they’re not free.) I was going to translate my survey into English and publish it as a data-set on an open-access platform that others could freely use, so that it could possibly become a standard for comparing different populations.

But another researcher has just done exactly this. I read her article on Thursday – 3 days ago – and realized that her survey and the articles she’s written about its purpose, development and face-validation, were exactly the articles that I was planning on writing. It’s all been done. I could kick myself for not reading her article before. It was published in February ’19 and has been in my EndNote-library since March. But since I’ve been so busy with course work and piloting my survey, I hadn’t read it until now. Kick, kick…

Nothing against her! Her articles and survey are really good! I just wish that I’d read them a few months ago.

I’ve been told that this sort of thing happens now and then in the world of research – that someone else has done similar research to your own and publishes it before you. But it doesn’t make it any easier.

My supervisors, who are amazingly positive people, are trying to turn this around into something, well, positive. Maybe I can collaborate with her, or use (some of) her survey questions, or translate her survey and validate it with Norwegian students?

And to be more precise, there are some differences between our surveys. Hers is for all adults, not just students, although she does have an add-on for higher education. And I’ve come further than her by piloting my survey and statistically analyzing the results, so I know that my questions are neither too easy nor too hard, and that they contribute to distinguishing between students with different levels of IL. Also, in my research I’ll be comparing the results of the survey (what the students KNOW about IL), with what they actually DO in their course work (how they evaluate and use their sources of information). This comparison is a form of criterion validity. (There are several different ways of validating research: face validity, content validity, criterion validity, and probably more…) So the survey is just one of three measuring tools that I’ll be using, and its development is not the sole purpose of my research. Somewhat consoling…

And just to make navigating my life even more excruciatingly difficult, my job in Hamar is now available (I have a 4-year leave-of-absence to do my PhD, and my temporary replacement is switching to another job), and my house, until yesterday, was empty (between 2 tenants)! The thought of quitting crossed my mind, I must admit, but I’m not going to give up! I’m committed to this. I have great supervisors, and I can do it. (I hope.)

So now the question is: HOW SHOULD I SOLVE THIS PROBLEM?  Should I use her questions or mine? The survey is due to go out this week. This is the biggest data collection period for my entire PhD research. And I don’t know what which survey to use.

To be continued…

Think-aloud protocol

I just finished my fifth and last “think-aloud protocol” to test students’ understanding of survey questions. My informants took the survey while commenting out loud about any misunderstandings or questions that they had. They could for example describe how they interpreted questions and answer alternatives, how they chose their answers, or what they were feeling and doing along the way. I observed them, took notes and recorded the sessions (with my handy little digital dictation machine).

I learned a lot from listening to how they interpreted the questions and reasoned while deciding how to answer. Based on these observations, I’ll now change the wording slightly in 3 survey questions, so they’re less likely to be misunderstood.

My informants were 3 freshman university students and 2 high school seniors. All were good at thinking out loud and describing their thought processes. They each got kr. 200 for their time, which is a good hourly wage since it took only 30 minutes! Surprisingly, the high school students chose more correct answers than the university students.

I couldn’t respond to questions they had until the end, since this would’ve influenced their choices. It was hard for me to remain silent and not react, especially when they chose the wrong answer, despite reasoning correctly in some cases!

I recommend the think-aloud method to anyone designing a survey! It’s helpful in bringing to light ambiguities and small misunderstandings – things that you may have thought were obvious or simple, but which in reality weren’t as clear-cut to everyone.

IRT and midnight sun

It’s been a while since I’ve posted a picture of my wonderful, brilliant,  encouraging supervisors, so here’s “Team Ellen” (as they say) at our last meeting before the summer.  🙂 They’re the best! 🙂

I passed both of my courses this semester: Quantitative research methods (statistics) and “Take control of your PhD-journey” (from the library). I’ll also receive credits for the courses that I took at HINN, so I’m well on my way toward completing my course credits. In this PhD-program, only 30 credits are from course work, while 150 are from the research and thesis, so I still have a lot of work to do!

Last week Torstein and I did some statistical analyses of the data we collected in the pilot study. Using the statistics program r, data from the 268 respondents were analyzed in an exploratory manner for two parameters in Item Response Theory (IRT) – item difficulty and item discrimination. R generated these item characteristic curves for our 16 items.

By interpreting their slopes and placement, these curves tell us how difficult the survey questions are and how well they discriminate between students with much of the latent trait “information literacy,” and those with little of the trait. This enabled us to further reduce the number of survey questions from 16 to 10. We’re trying to accurately measure certain aspects of IL with as short a survey as possible.

But now it’s actually sunny and warm here in Tromsø (the warmest it’s been since I arrived in October), so I’ll continue with more on a cloudy day. And for the astronomically interested: the sun rose today at 1:03 AM and won’t set until July 27th! Welcome MIDNIGHT SUN! 🙂

New research design

I did a pilot with the survey and have analyzed the data using Classical test theory (CTT), which enabled me to reduce the number of questions (items) from 50 to 17, keeping only the most useful items. I’ll soon analyze pilot data also with factor analysis and IRT, and use think-aloud protocols to help formulate the questions in an understandable way. Then the survey will be ready for the most important data collection point, in August.

My supervisors had warned me right from the start that there would be changes in my research design along the way, for various reasons. So I wasn’t too surprised when I heard last week about a scheduling change in the course that I’ll be collecting data from. Starting with the 2020 cohort, the course will be held in the spring semester instead of the fall semester, making it hard to compare these students with others classes. So, I had to make the first major change in my research design.

It took a few days for me to wrap my head around what this schedule change would entail for my research. Somehow this process ended up with a plan to write 4 articles instead of 3, and collecting data at 12 different points in time. Wish me luck!

I have data!

I’ve now completed data collection for my pilot survey, and have taken a peek at it in the statistics program SPSS. I haven’t used this program before, but it looks like it should be fairly easy to learn (famous last words!). I’m now coding in the correct answers.

Here’s what my data looks like.

I thought that I’d gotten 408 responses from students, but when I looked more closely, several hadn’t answered all the questions. I really only got 268 usable responses, but that’s still enough since I only needed 5 times the number of questions (51).

Tove and Torstein helped me to get started today with exporting and “cleaning” my data. They also showed me how to do the tests I need in order to determine which questions (called “items” in research) are useful, and to eliminate items that aren’t useful. For this I’ll use Classical test theory (Point biserial correlation and Item facility), Exploratory factor analysis, and Item response theory.

Yippee! I’m on my way!

Today’s exam

Today I had a 2-hour final exam in my statistics class. It was a digital exam with 19 short answer, multiple choice, and fill-in-the-blank  questions. It’s pass/fail, and although I know that I got some questions (partly) wrong, I’m pretty sure I’ll pass.  The first question was really hard, and I was worried that if all were that difficult I’d be in serious trouble, but luckily there were some easier questions too.  Most of the topics were covered in the lectures, but one question included a term that I’d never heard before, so I just had to “row” as we say in Norwegian (or “BS” as we say in English!).

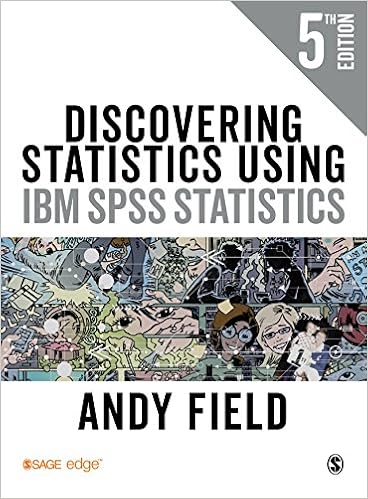
This is our textbook and it’s actually quite funny. The author makes statistics (almost) enjoyable!

I studied hard and struggled learning the material, using flash cards towards the end to memorize definitions and formulas. It was a useful, yet sometimes frustrating (see my last blog post) process, and goes to show that one can still learn new things at the ripe age of √3364! 🙂

Speaking of numbers, I started as a PhD student 6 months ago today! My trial period is over in a few hours, and since no one has asked me to leave yet, I’ll most likely stay for another 3 1/2 years. 🙂

Statistics (or is it “Sadistics”?) class

Argh! I thought I liked numbers, but I’m totally baffled by the statistics class I’m taking. The teachers are wonderful and the textbook is great, but I just can’t get my head around the null hypothesis that’s used to calculate statistical significance. It’s like my brain is willing to go just so far, and no further.

Our teachers ask often if there are any questions, and no one asks. It’s either because everyone else understands it, or perhaps, like me, they don’t understand enough to even formulate a question. This is incredibly frustrating, as my research is quantitative, and I totally need statistics!

The only thing I understood today was when the teacher asked  “Do we have enough evidence to recommend that our patients switch to another brand of cigarettes?” And the answer was no – we should recommend that they quit smoking instead. But that’s not exactly statistics…

Hopefully, before the exam on April 11th, I’ll somehow understand more – otherwise I’m in trouble.

Thanks, Matthias, for trying to make statistics fun: